
ECG Interpretation: A Systematic Method
Key points
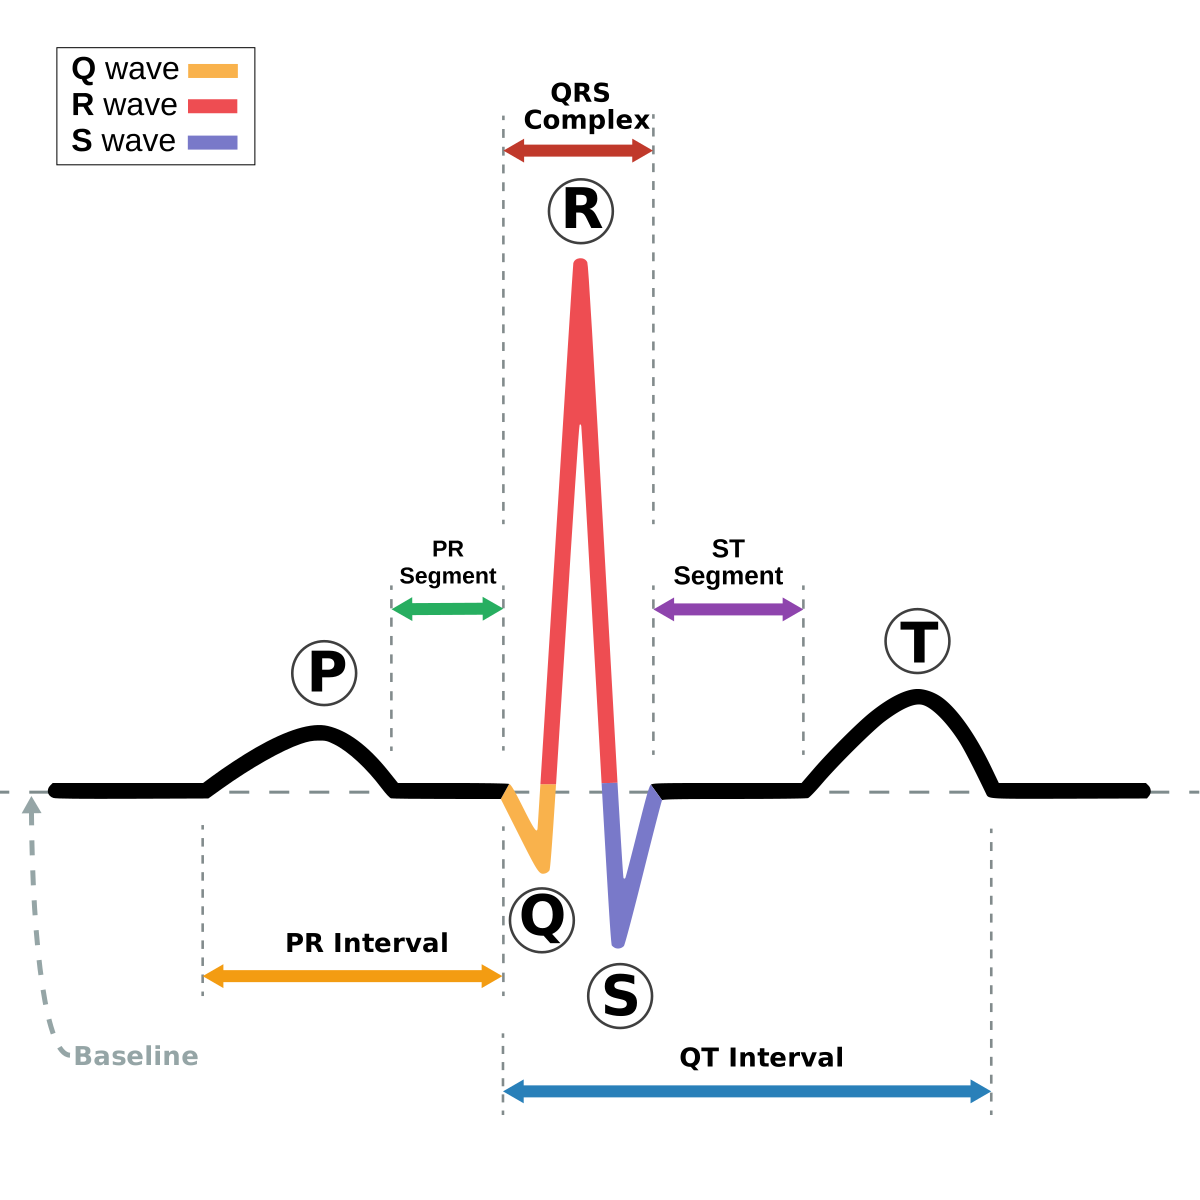
- Standard settings: 25 mm/s paper speed and 10 mm/mV gain. One small square is 0.04 s, one large square is 0.2 s, and five large squares are 1 second.
- Rate: 300 divided by the number of large squares between R waves if regular; count the QRS complexes on the rhythm strip and multiply by 6 if irregular.
- Normal intervals: PR 120-200 ms (3-5 small squares), QRS under 120 ms (3 small squares), QTc under 440 ms in men and 460 ms in women.
- Axis: look at leads I and aVF. Both positive is normal; lead I positive with aVF negative is left axis deviation; lead I negative with aVF positive is right axis deviation.
- ST elevation: 1 mm or more in two contiguous limb leads, or 2 mm or more in two contiguous chest leads, with the higher thresholds in V2-V3.
- Territories: II, III and aVF are inferior; V1-V4 are septal and anterior; I, aVL, V5 and V6 are lateral. Regional changes mean ischaemia; widespread changes suggest pericarditis.
- Broad QRS: look at V1. An RSR pattern with a broad S wave in lateral leads is right bundle branch block; a dominant S in V1 with a notched R in V6 is left bundle branch block.
- Golden rule: always interpret the ECG alongside the patient and, where possible, alongside a previous ECG. A new change matters far more than an abnormal-looking baseline.
Introduction
The electrocardiogram records the electrical activity of the heart from the body surface. It is cheap, immediate, non-invasive and, in acute coronary syndrome and arrhythmia, the investigation on which the next decision turns. It is also the investigation students find most intimidating, largely because it is often taught as a collection of patterns to be recognised rather than as a document to be read systematically.
The remedy is a fixed sequence, used on every ECG regardless of how obvious the abnormality appears. This matters because a dramatic finding draws the eye and hides a second one: the anterior ST elevation is noticed and the complete heart block underneath it is not.
The paper
ECG paper runs at a standard 25 mm per second with a calibration of 10 mm per millivolt.4 Confirm both from the calibration mark at the start of the trace before measuring anything, because a machine set to 50 mm/s will make every interval look twice as long.
| Square | Horizontal (time) | Vertical (voltage) |
|---|---|---|
| One small square (1 mm) | 0.04 s (40 ms) | 0.1 mV |
| One large square (5 mm) | 0.2 s (200 ms) | 0.5 mV |
| Five large squares (25 mm) | 1 second | 2.5 mV |
| Fifteen large squares | 3 seconds | - |
The leads
Twelve leads give twelve electrical views of the heart from different angles. Each looks at a particular region, and knowing which lead looks where is what turns a pattern into a diagnosis.
| Leads | Territory | Usual artery |
|---|---|---|
| II, III, aVF | Inferior | Right coronary artery |
| V1-V2 | Septal | Left anterior descending |
| V3-V4 | Anterior | Left anterior descending |
| V5-V6, I, aVL | Lateral | Left circumflex |
| V7-V9 (posterior leads) | Posterior | Right coronary or circumflex |
| V3R-V4R (right-sided leads) | Right ventricle | Proximal right coronary artery |
| aVR | Right upper chest cavity | Views the heart from the opposite direction; ST elevation here suggests left main or triple vessel disease |
The systematic method
Work through these steps in the same order every time. Say them out loud in an OSCE - examiners award marks for the system as much as for the answer.
- Details: patient name, date, time, and whether this is symptomatic or asymptomatic. Ask for a previous ECG.
- Calibration and speed: confirm 25 mm/s and 10 mm/mV.
- Rate
- Rhythm
- Axis
- P waves
- PR interval
- QRS complex - width, height, Q waves, progression
- ST segment
- T waves
- QT interval
- Additional features - U waves, J waves, delta waves, pacing spikes
- Summary and clinical correlation
Rate
The normal resting rate is 60-100 beats per minute. Below 60 is bradycardia and above 100 is tachycardia, although both may be entirely physiological - an athlete at 45/min and a frightened patient at 110/min are both normal.
- Regular rhythm: divide 300 by the number of large squares between two consecutive R waves. Six large squares gives 50/min, three gives 100/min, two gives 150/min.
- Irregular rhythm: the above method fails. Count the QRS complexes on the 10-second rhythm strip and multiply by 6. Alternatively count complexes in 30 large squares (6 seconds) and multiply by 10.
- Very slow rates: count complexes across the whole strip and extrapolate.
Rhythm
Answer three questions in order and the rhythm will usually name itself.
- Is it regular? Mark consecutive R waves on a piece of paper and slide it along the strip. Regularly irregular suggests second degree AV block or bigeminy; irregularly irregular suggests atrial fibrillation.
- Is there a P wave before every QRS, and a QRS after every P wave? Upright P waves in leads II and aVF indicate a sinus origin.
- Is the QRS narrow or broad? Narrow means the impulse reached the ventricles through the normal conducting system, so it must have originated at or above the AV node.
| Rhythm | Rate | P waves | QRS | Regularity |
|---|---|---|---|---|
| Sinus rhythm | 60-100 | One before each QRS, upright in II | Narrow | Regular |
| Sinus arrhythmia | Variable | Normal | Narrow | Varies with respiration - normal in the young |
| Atrial fibrillation | Variable | Absent; chaotic baseline | Narrow | Irregularly irregular |
| Atrial flutter | Atrial ~300 | Sawtooth flutter waves, best seen in II, III, aVF | Narrow | Regular if fixed block, irregular if variable |
| AVNRT / AVRT | 140-250 | Hidden in QRS or inverted after it | Narrow | Regular |
| Ventricular tachycardia | 100-250 | Dissociated if visible | Broad | Regular |
| Ventricular fibrillation | Chaotic | None | None identifiable | Chaotic - no output |
| Complete heart block | Ventricular 20-50 | Present but unrelated to QRS | Narrow or broad | Regular P-P and R-R, but dissociated |
Axis
The cardiac axis is the overall direction of ventricular depolarisation in the frontal plane. The normal range is -30 to +90 degrees.
The quickest method uses leads I and aVF, and relies on the principle that a QRS complex is positive in any lead the impulse travels towards.
| Lead I | Lead aVF | Axis | Common causes |
|---|---|---|---|
| Positive | Positive | Normal | - |
| Positive | Negative | Left axis deviation | Left anterior fascicular block, inferior MI, left ventricular hypertrophy, ostium primum ASD, hyperkalaemia |
| Negative | Positive | Right axis deviation | Right ventricular hypertrophy, pulmonary embolism, chronic lung disease, lateral MI, left posterior fascicular block, ostium secundum ASD, normal in tall thin young people |
| Negative | Negative | Extreme axis deviation (northwest axis) | Ventricular rhythm, hyperkalaemia, lead misplacement |
P waves and the PR interval
P waves
A normal P wave is under 120 ms wide (3 small squares) and under 2.5 mm tall, and is upright in leads II and aVF.
- Absent P waves - atrial fibrillation, sinoatrial arrest, junctional rhythm, or hyperkalaemia
- P pulmonale - tall, peaked P waves over 2.5 mm in lead II, indicating right atrial enlargement from pulmonary hypertension, tricuspid stenosis or chronic lung disease
- P mitrale - broad, bifid P waves over 120 ms in lead II, indicating left atrial enlargement, classically from mitral stenosis
- Inverted P waves in II - a junctional or low atrial focus, or reversed limb leads
- Sawtooth waves - atrial flutter
- More P waves than QRS complexes - second or third degree AV block
PR interval
Measured from the start of the P wave to the start of the QRS. Normal is 120-200 ms (3-5 small squares).
| Finding | Interpretation |
|---|---|
| Short (under 120 ms) with a delta wave | Pre-excitation - Wolff-Parkinson-White syndrome |
| Short without a delta wave | Junctional rhythm, or Lown-Ganong-Levine pattern |
| Fixed prolongation over 200 ms | First degree AV block |
| Progressive lengthening then a dropped beat | Mobitz type I (Wenckebach) second degree AV block |
| Constant, with intermittent dropped beats | Mobitz type II second degree AV block |
| Variable, with P waves unrelated to QRS | Complete (third degree) heart block |
| PR segment depression | Pericarditis |
The QRS complex
Width
Normal QRS duration is under 120 ms. A broad QRS means ventricular activation did not use the normal conducting system, either because the impulse originated in the ventricle or because a bundle branch is blocked.5
Height and voltage criteria
Left ventricular hypertrophy is suggested by the Sokolow-Lyon criteria: the S wave in V1 plus the R wave in V5 or V6 exceeding 35 mm, or an R wave in aVL over 11 mm. Look also for a strain pattern - downsloping ST depression and T wave inversion in the lateral leads.
Right ventricular hypertrophy gives a dominant R wave in V1, right axis deviation, and T wave inversion in V1-V3.
Small complexes (under 5 mm in the limb leads, under 10 mm in the chest leads) suggest a pericardial effusion, obesity, emphysema, or hypothyroidism.
Q waves
Small, narrow septal Q waves in the lateral leads (I, aVL, V5, V6) are normal. Pathological Q waves - deeper than 2 mm, wider than 40 ms, or more than 25% of the height of the following R wave - indicate previous transmural infarction in that territory.
R wave progression
The R wave should grow progressively from V1 to V6, with the transition point (where R equals S) at V3 or V4. Poor R wave progression suggests anterior infarction, left ventricular hypertrophy, chronic lung disease or, commonly, lead misplacement. A dominant R wave in V1 suggests posterior infarction, right ventricular hypertrophy, RBBB, or Wolff-Parkinson-White syndrome type A.
ST segment and T waves
The ST segment should be at the same level as the isoelectric line, taken from the TP segment. Deviation is measured at the J point, where the QRS meets the ST segment.
ST elevation
| Cause | Distinguishing features |
|---|---|
| STEMI | Regional, follows a coronary territory, with reciprocal depression in the opposite leads. Convex upwards (tombstoning). |
| Pericarditis | Widespread, saddle-shaped (concave upwards), with PR depression and PR elevation in aVR. No reciprocal change. |
| Benign early repolarisation | Young patients, concave elevation with notched J points, most marked in V2-V5, stable over time |
| Left ventricular aneurysm | Persistent elevation weeks after an infarct, with Q waves and no reciprocal change |
| Brugada syndrome | Coved elevation in V1-V2 with T wave inversion |
| Prinzmetal (vasospastic) angina | Transient, resolves with nitrates |
| Left bundle branch block and LVH | Elevation discordant with the QRS - assess with the Sgarbossa criteria |
ST depression
Horizontal or downsloping depression of 0.5 mm or more suggests subendocardial ischaemia (NSTEMI or angina). Other causes are digoxin effect (a downsloping, reverse-tick appearance), left ventricular strain, hypokalaemia, and reciprocal change from an infarct elsewhere. Upsloping depression during tachycardia is usually not significant.
T waves
- Tall, tented T waves - hyperkalaemia (with a flattened P wave and widened QRS as it progresses), or the hyperacute phase of a STEMI
- Inverted T waves - ischaemia, previous infarction, ventricular strain, pulmonary embolism, raised intracranial pressure (deep, wide 'cerebral' T waves), or normal in V1, in lead III, and in children
- Flattened T waves - hypokalaemia, non-specific change
- Biphasic T waves in V2-V3 (Wellens syndrome) - critical proximal LAD stenosis. This is a warning of impending large anterior infarction and needs urgent angiography, not a stress test.6
- De Winter T waves - upsloping ST depression with tall symmetrical T waves in the precordial leads, an anterior STEMI equivalent
QT interval and other features
QT interval
Measured from the start of the QRS to the end of the T wave, and corrected for heart rate (QTc). Normal is under 440 ms in men and 460 ms in women. A QTc above 500 ms carries a substantially increased risk of torsades de pointes.
- Prolonged QT - congenital long QT syndrome, hypokalaemia, hypomagnesaemia, hypocalcaemia, hypothermia, and many drugs including amiodarone, sotalol, macrolides, quinolones, antipsychotics, methadone, ondansetron and citalopram
- Short QT - hypercalcaemia, digoxin, and the rare congenital short QT syndrome
Additional findings
- U waves - small deflections after the T wave, seen in hypokalaemia and bradycardia
- Delta wave - a slurred upstroke to the QRS with a short PR, indicating an accessory pathway (Wolff-Parkinson-White)
- J waves (Osborn waves) - a notch at the J point in hypothermia
- Pacing spikes - narrow vertical deflections before the P wave (atrial pacing) or QRS (ventricular pacing). A ventricular paced rhythm normally has an LBBB morphology.
- Electrical alternans - beat-to-beat variation in QRS amplitude, classically in a large pericardial effusion with tamponade
- Epsilon wave - a small deflection at the end of the QRS in V1-V2, seen in arrhythmogenic right ventricular cardiomyopathy
Patterns worth recognising instantly
| Pattern | Diagnosis | Action |
|---|---|---|
| Regional ST elevation with reciprocal depression | STEMI | Activate primary PCI pathway immediately |
| Widespread saddle ST elevation with PR depression | Acute pericarditis | NSAID plus colchicine; echocardiogram for effusion |
| Tall tented T waves, flat P waves, broad QRS, sine wave | Hyperkalaemia | IV calcium gluconate for cardiac protection, then insulin-dextrose |
| Irregularly irregular, absent P waves | Atrial fibrillation | Rate or rhythm control; assess CHA2DS2-VASc |
| Broad complex regular tachycardia | Ventricular tachycardia until proven otherwise | Assess adverse features; amiodarone or cardioversion |
| Polymorphic VT with twisting axis | Torsades de pointes | Magnesium 2 g IV; stop QT-prolonging drugs |
| Short PR with delta wave | Wolff-Parkinson-White | Avoid AV nodal blockers if AF develops; refer for ablation |
| S1Q3T3, sinus tachycardia, RBBB, right axis | Pulmonary embolism (though sinus tachycardia alone is commonest) | CTPA and anticoagulation |
| Coved ST elevation V1-V2 with T inversion | Brugada syndrome | Refer for inherited cardiac conditions assessment |
| Biphasic or deeply inverted T waves in V2-V3 | Wellens syndrome - critical LAD stenosis | Urgent angiography; do not stress test |
| Electrical alternans with small complexes | Large pericardial effusion, likely tamponade | Urgent echocardiogram and pericardiocentesis |
| P waves unrelated to QRS, slow broad escape | Complete heart block | Atropine, prepare for pacing |
Pitfalls and artefact
Not every abnormal-looking ECG reflects abnormal physiology. Before acting on a striking finding, consider whether the recording itself is at fault.
- Limb lead reversal - the commonest technical error. Right and left arm reversal produces a negative P wave, QRS and T wave in lead I, with an inverted lead I resembling dextrocardia.
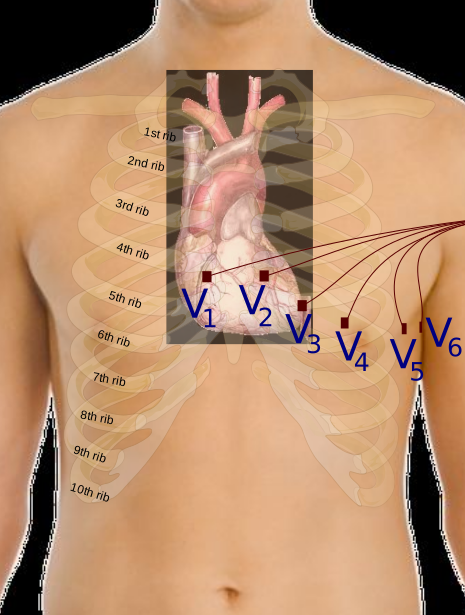
- Chest lead misplacement - causes apparent poor R wave progression or pseudo-infarction patterns. V1 and V2 placed too high is very common. See the figure below for the correct positions.
- Muscle tremor - an irregular baseline that can mimic atrial fibrillation; the R-R intervals remain regular
- AC interference - regular 50 Hz noise across all leads
- Wandering baseline - from respiration or poor electrode contact
- Wrong paper speed or gain - always check the calibration mark
- Dextrocardia - inverted P, QRS and T in lead I with reversed R wave progression, distinguished from lead reversal by the chest leads
Presenting an ECG
In an OSCE or on a ward round, present the ECG in the order you read it, and finish by linking it to the patient. A confident structure earns marks even when the abnormality is subtle.
A worked example: "This is a 12-lead ECG for Mr Smith, recorded today at 14:20 while he was experiencing chest pain, at standard calibration. The rate is 88 beats per minute and the rhythm is regular sinus rhythm. The axis is normal. P waves are normal with a PR interval of 160 milliseconds. The QRS is narrow at 90 milliseconds with no pathological Q waves. There is 3 millimetres of ST elevation in leads II, III and aVF, with reciprocal ST depression in leads I and aVL. T waves and the QT interval are otherwise unremarkable. In summary, this is an acute inferior ST-elevation myocardial infarction. I would activate the primary PCI pathway immediately, give aspirin 300 milligrams, obtain right-sided leads to look for right ventricular involvement, and reassess the patient."
Red flags
References
- Resuscitation Council UK. Adult advanced life support guidelines. Available here
- NICE NG185. Acute coronary syndromes. 2020, updated 2025. Available here
- Thygesen K, Alpert JS, Jaffe AS et al. Fourth universal definition of myocardial infarction. European Heart Journal. 2018. Available here
- Rautaharju PM, Surawicz B, Gettes LS et al. AHA/ACCF/HRS recommendations for the standardization and interpretation of the electrocardiogram. Circulation. 2009. Available here
- Surawicz B, Childers R, Deal BJ et al. AHA/ACCF/HRS recommendations for intraventricular conduction disturbances. Circulation. 2009. Available here
- de Zwaan C, Bar FW, Wellens HJ. Characteristic electrocardiographic pattern indicating a critical stenosis high in left anterior descending coronary artery. American Heart Journal. 1982. Available here
- NICE CG109. Transient loss of consciousness (blackouts) in over 16s. 2010, updated 2023. Available here
- Brugada J, Katritsis DG, Arbelo E et al. 2019 ESC Guidelines for the management of patients with supraventricular tachycardia. European Heart Journal. 2020. Available here
This article is written for revision and education. It is not clinical guidance and must not be used to make decisions about the care of a patient. Always check current NICE guidance and local protocols.